2022: THE YEAR OF PAIN
2022 was a tough year for many market participants. The benchmarks for the United States economy, S&P 500 ($SPY), NASDAQ 100 ($QQQ) and the Dow Jones Industrial Average ($DIA) all had losing years. These indices were down 16.58%, 30.05% and 6.19%, respectively.
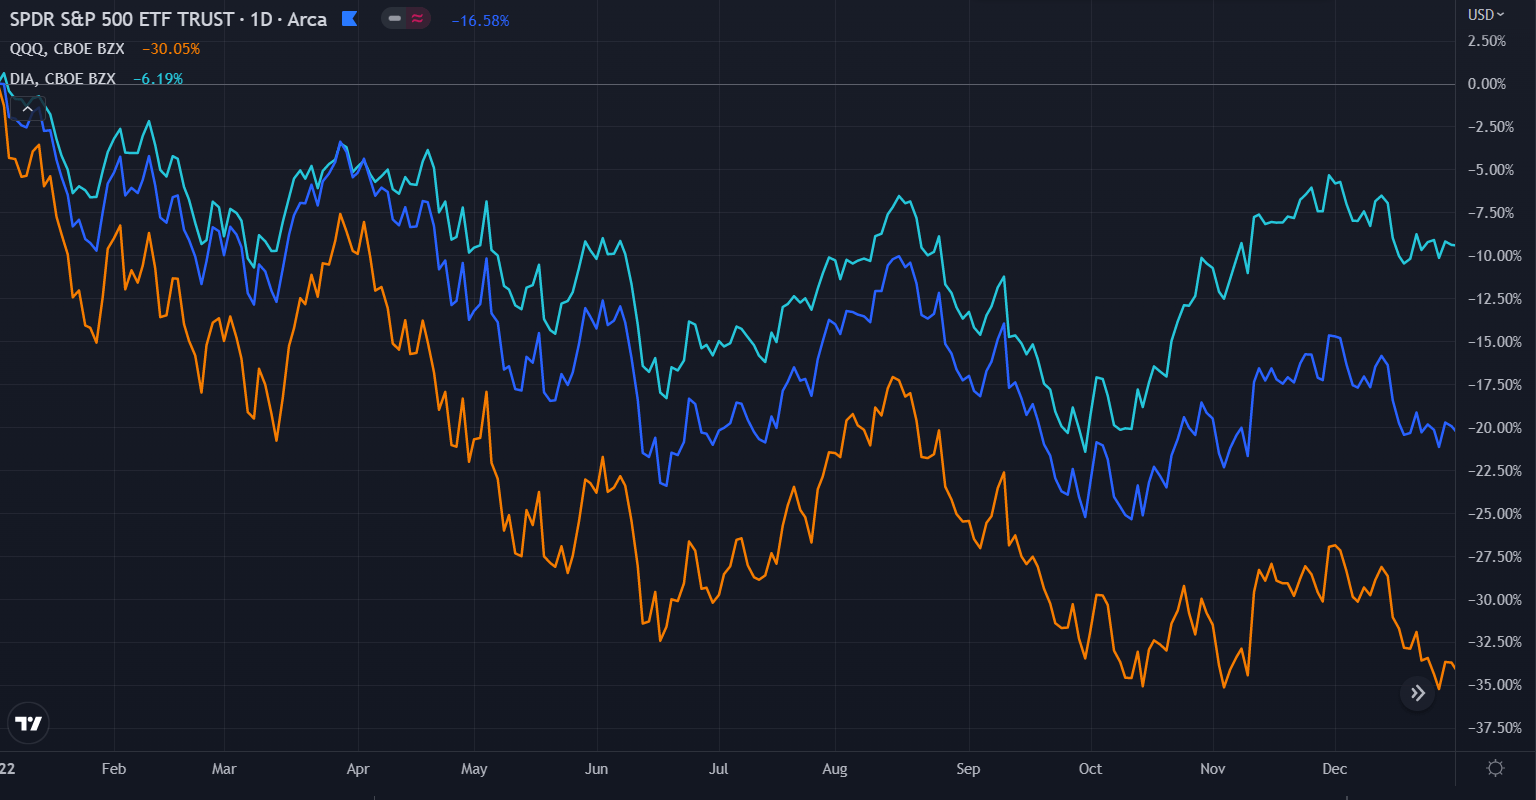
(2022 performance of $SPY, $QQQ and $DIA)
This was the first losing year for these powerhouses since 2018 and the largest yearly decline since the 2008 Financial Crisis. The “safety” of mega-cap stocks was tested during last year’s bear market and investors learned that no asset can rise in value forever.
US bonds and cryptocurrencies were crushed in compassion to US equities. The iShares 20+ Year Treasury Bond ETF ($TLT) had its worst year in the history of the ETF. Shares lost 30.72% of their value, fueled by the FED raising interest rates to combat inflation.
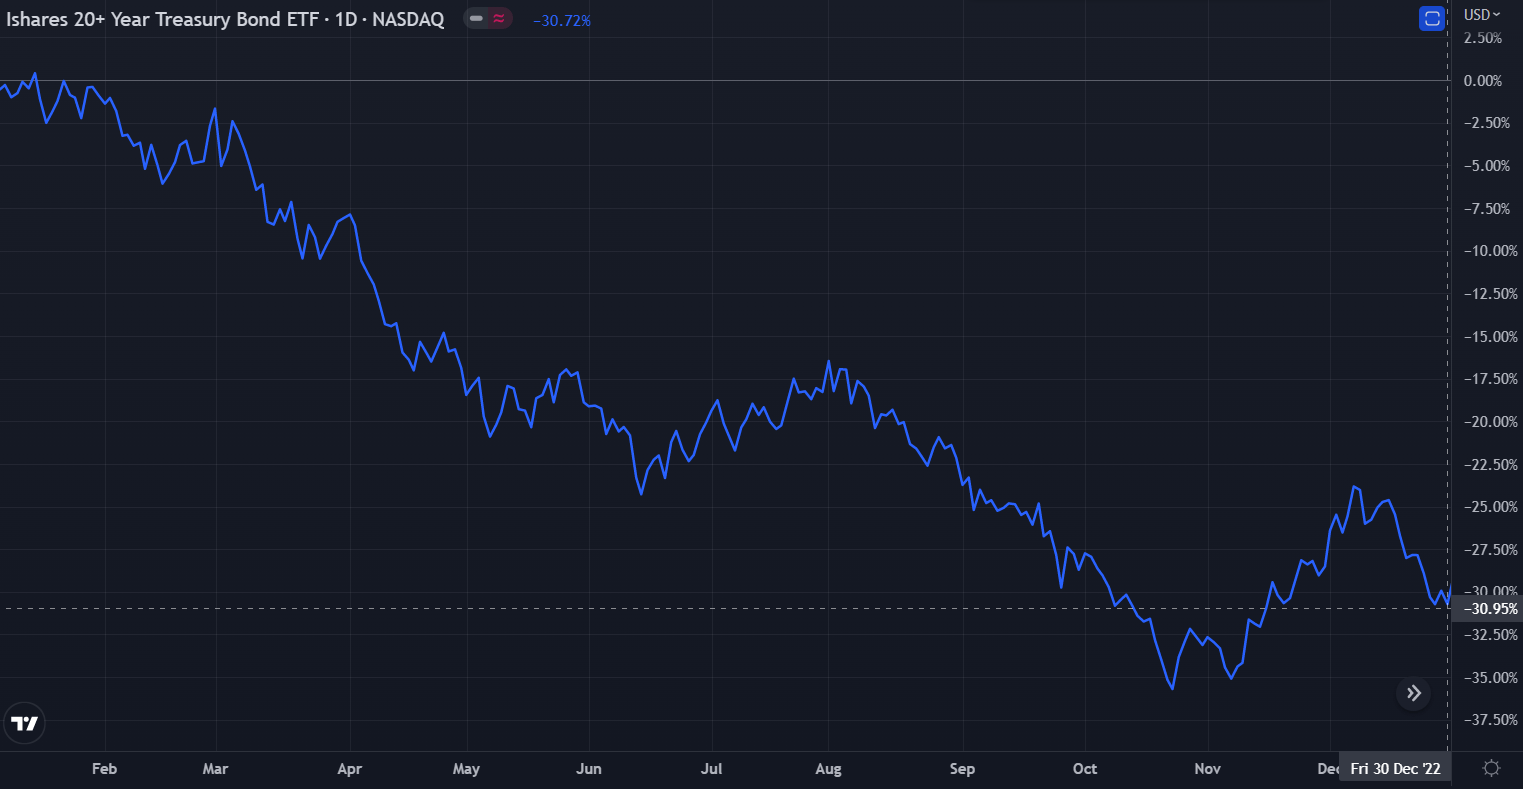
($TLT 2022 performance)
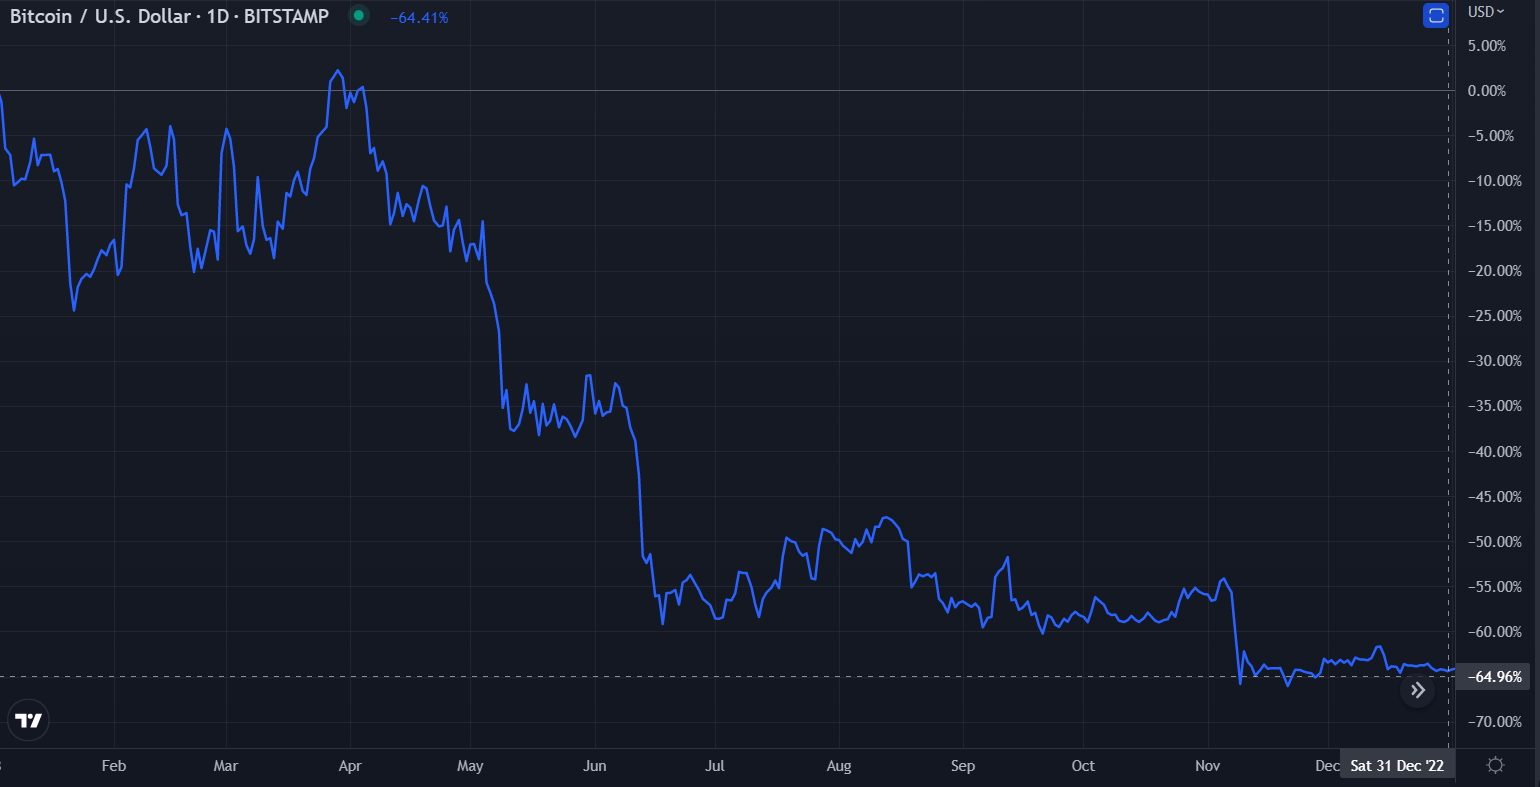
($BTC 2022 performance)
Bitcoin ($BTC) also experienced a disappointing year in 2022, falling 64.41%. Bitcoin is seen as the “most stable” cryptocurrency and this rings true when you compare its 2022 performance in some of its small market-cap counterparts.
Solana ($SOL), a popular alternative to Ethereum ($ETH), had a very public blowup during 2022 and managed to lose 94.14% of its market-cap.
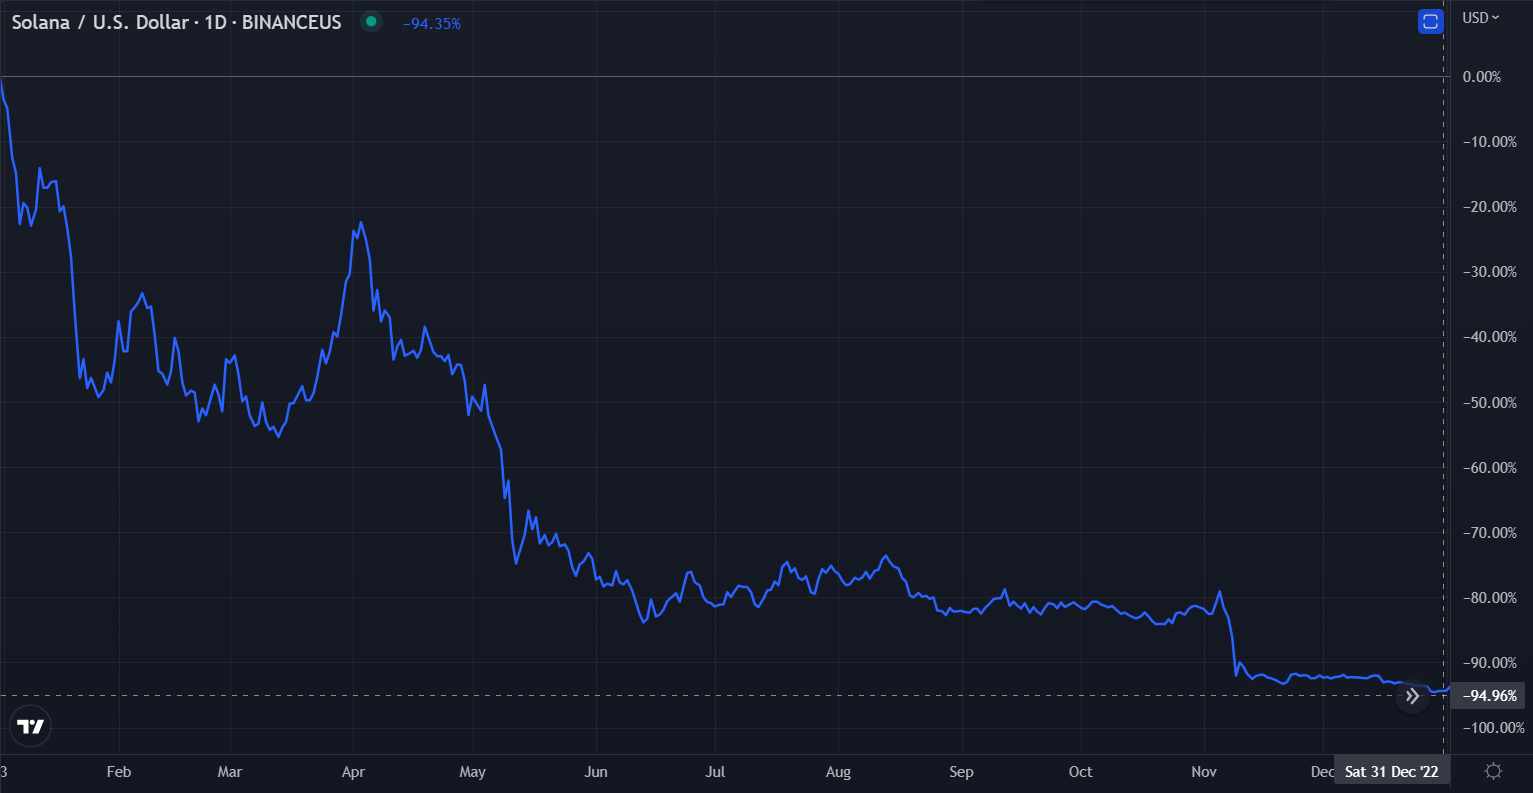
($SOL 2022 performance)
WHERE DOES 2023 POINT TO:
So what does all of this have to do with 2023 and what predictions can you infer from this year’s brief trading action? Two weeks into 2023, the laggers of 2022 have been the best performing assets year-to-date (YTD). Market participants are bottoming fish. Their money is flowing into the assets that appear to be “cheap.” At the very least, you can say that money has not been overwhelmingly flowing into assets that display “relative strength.” Relative strength is a term used in technical analysis.
Try and visualize three boats trying to fight the current of the river. One boat has no one rowing, one boat has a crew rowing, and the other boat has a strong engine. Which boat do you think has the best shot of making it upstream? Obviously, it is the boat with a strong engine! Now think of the current pushing against the boats as the $SPY. When the market is in a downtrend, most stocks and assets will flow with the current and lose market value. But there will always be assets that have a strong engine and can fight against that current, gaining market value.
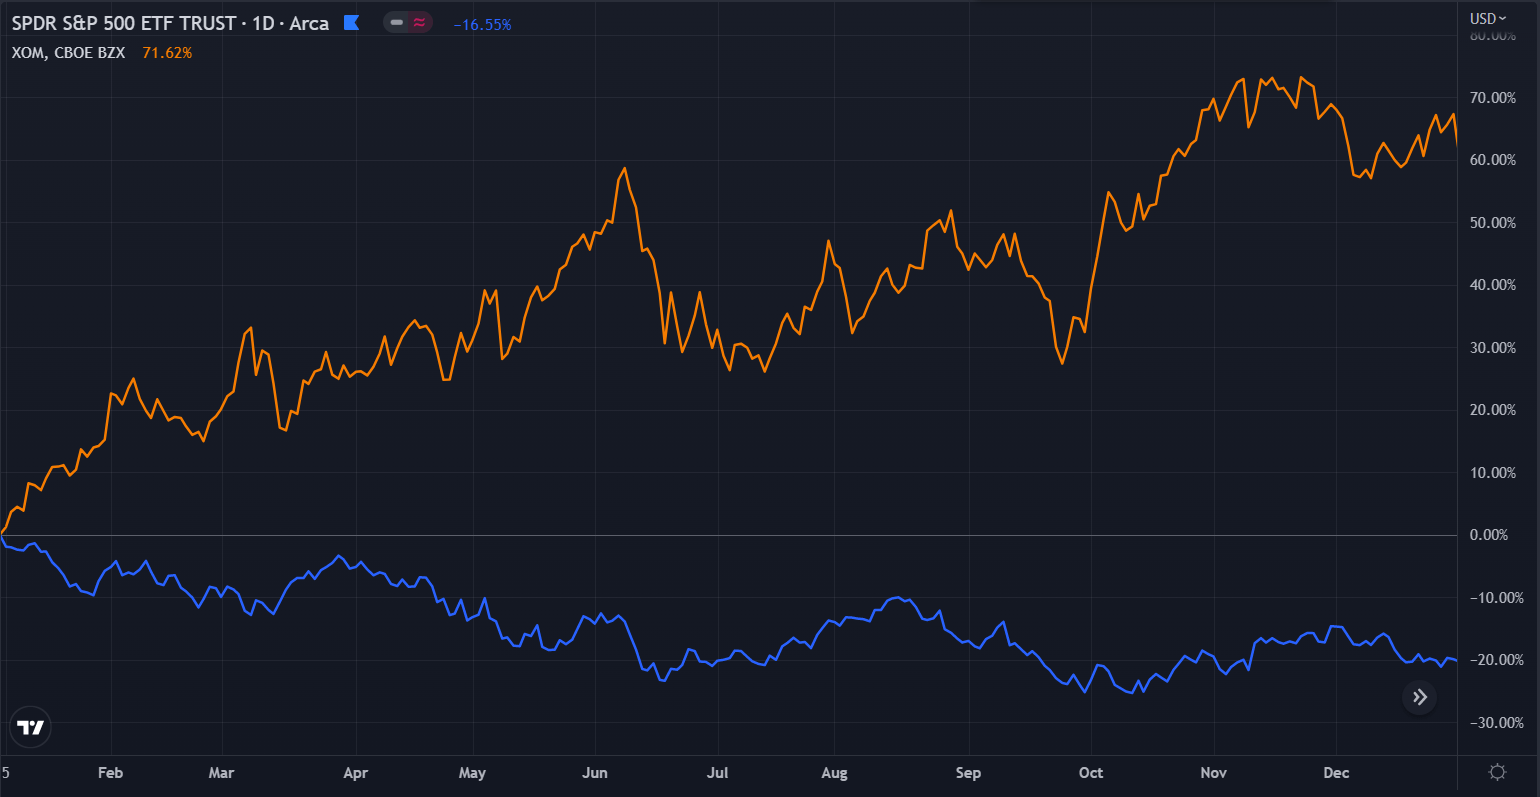
($XOM vs $SPY in 2022)
The above chart is a great example of relative strength. During 2022, energy companies dominated all other assets. Exxon Mobil ($XOM) closed out 2022 up 71.62%. That’s an 88.17 percentage point difference when compared to $SPY. That is a master class in relative strength.
In a strong bull market, with the current flowing with assets ($SPY gaining market value), the assets with a strong engine will move even faster (gain market value rapidly). That is not what 2023 has experienced. Even with the $SPY up 5.00% YTD, the leading assets have not been the ones displaying relative strength. Warner Bros. Discovery ($WBD) closed 2022 down 50.88%, almost twice the value of $QQQ.
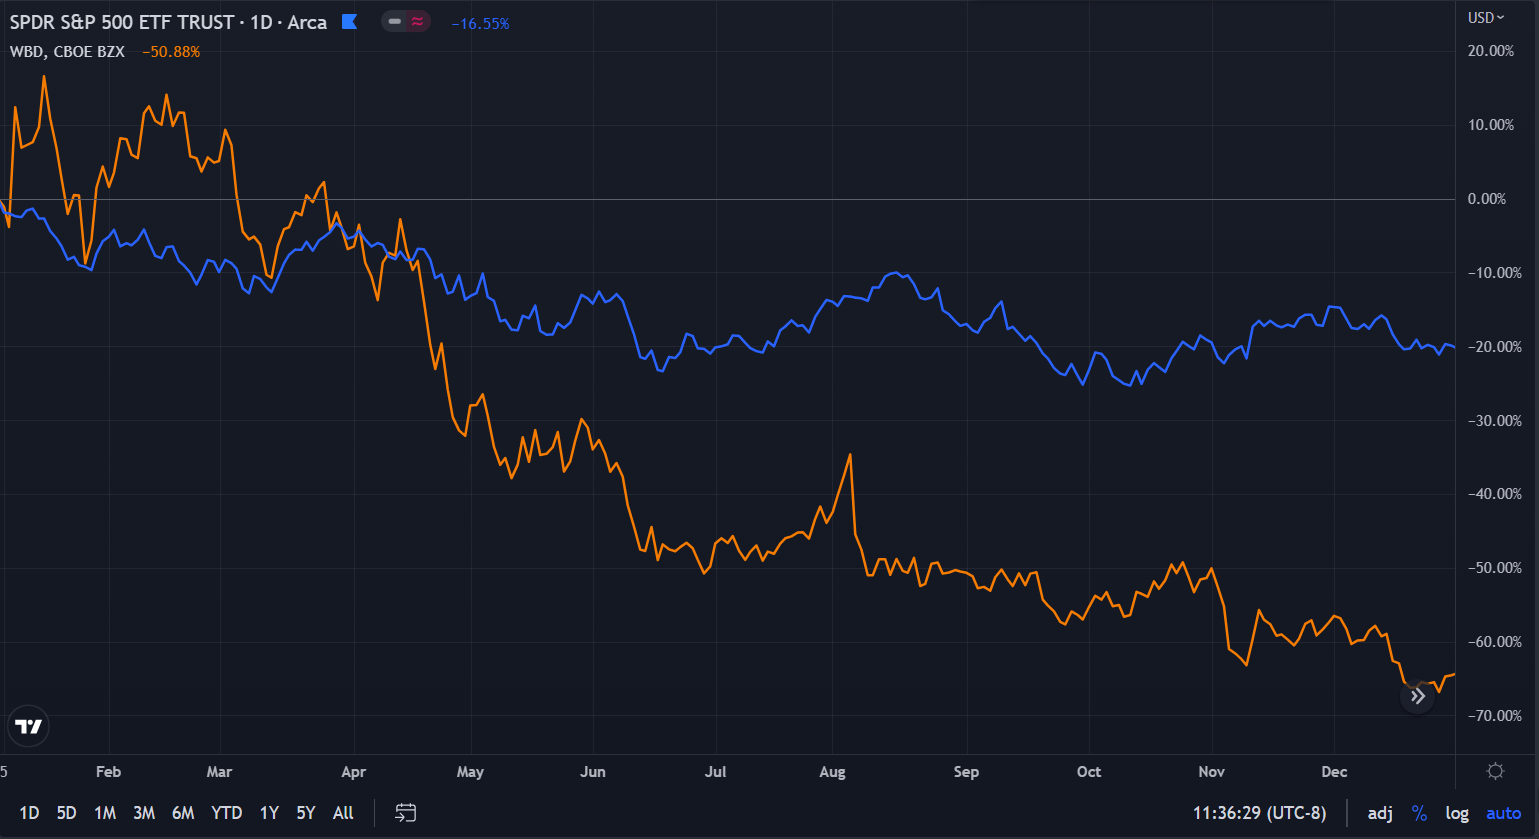
($WBD vs $SPY in 2022)
That is not relative strength. But $WBD is up 37.14% in 2023. 37.14% is the best performance of all stocks in $SPY.
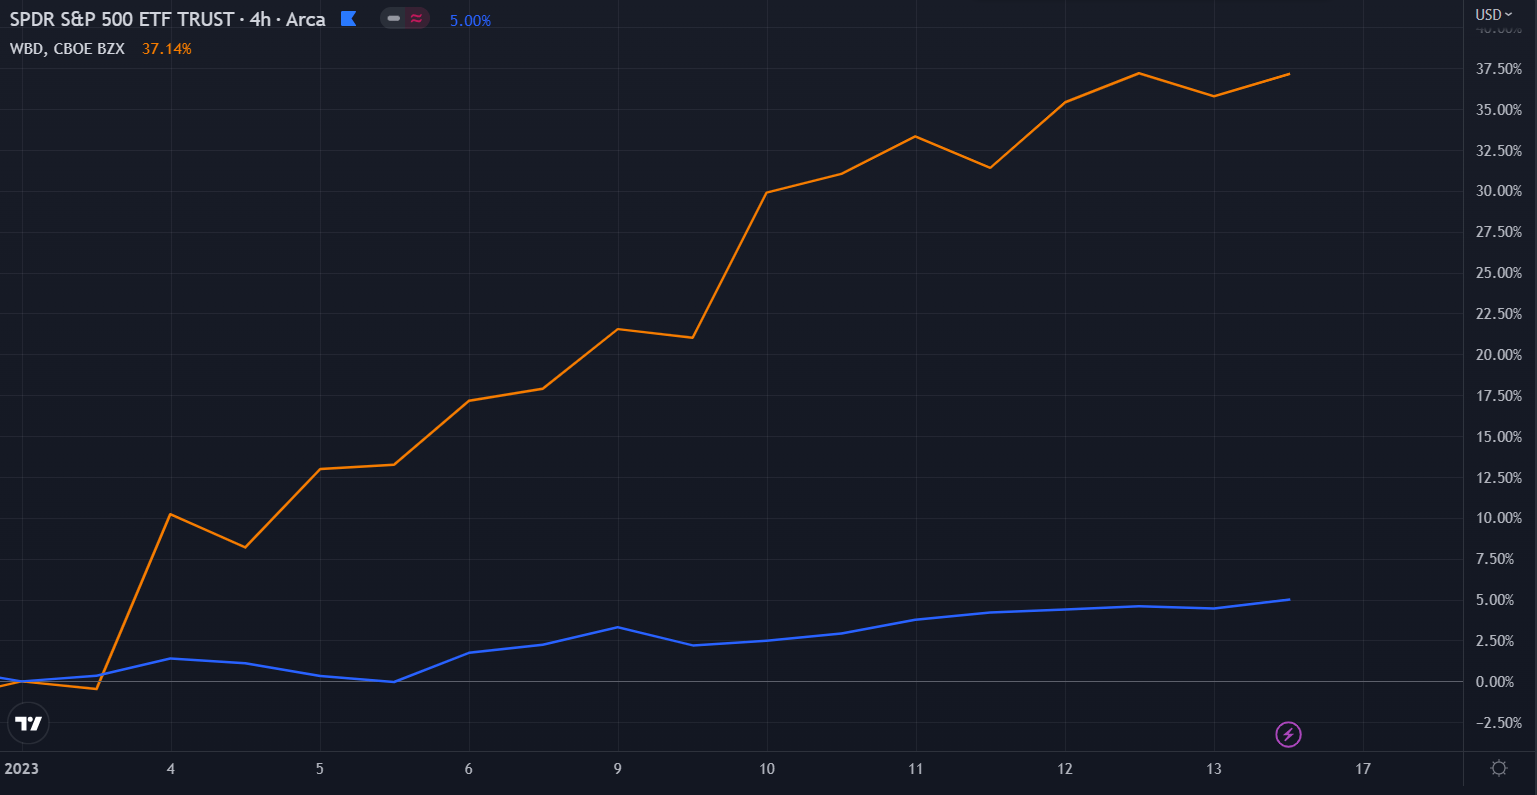
($WBD vs $SPY in 2023)
Lucid Group ($LCID), a popular EV stock among retail investors, experienced a decline of 82.05% in 2022. YTD in 2023, $LCID is up 30.45%, the fourth best performer in $SPY.
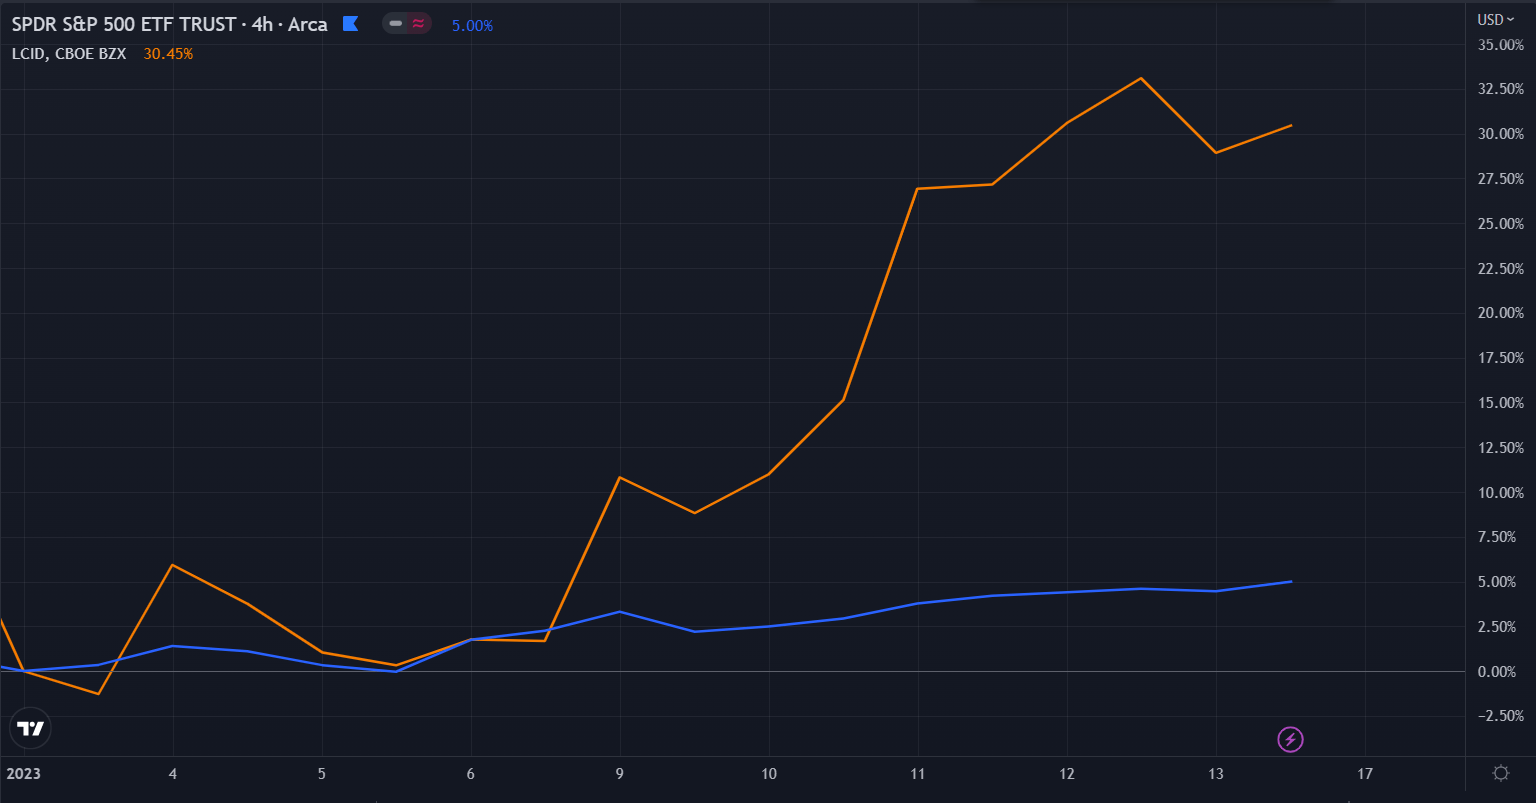
($LCID vs $SPY in 2023)
MercadoLibre ($MELI) is another great example of a lagger turned leader. $MELI closed 37.24% lower in 2022. In 2023, $MELI is up 31.79%.
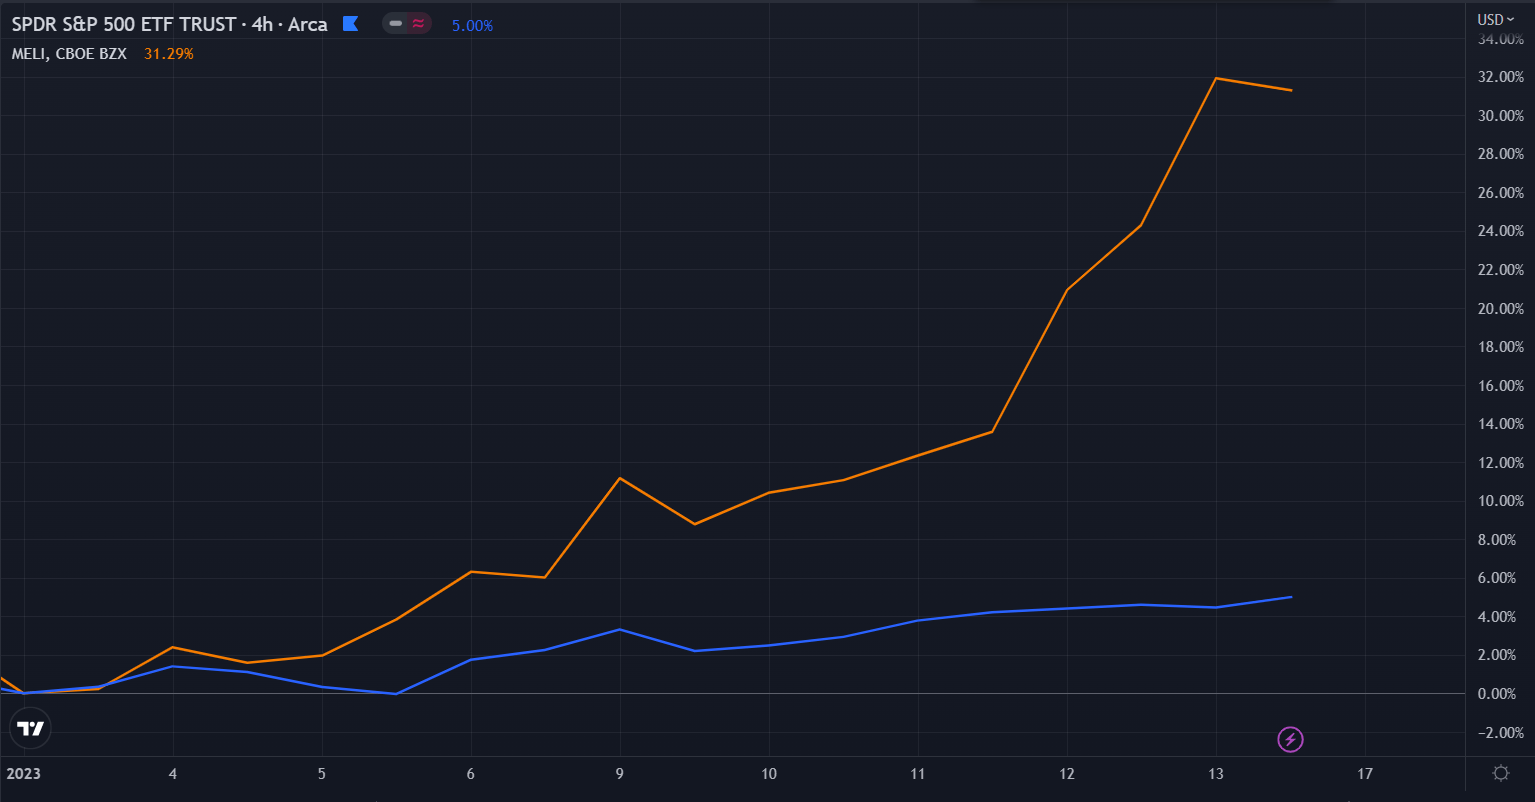
($MELI vs $SPY in 2023)
Lastly, take a look at $SOL. Down 94.14% in 2022, $SOL is up 133.12% in 2023, outpacing $BTC by 107.66 percentage points.
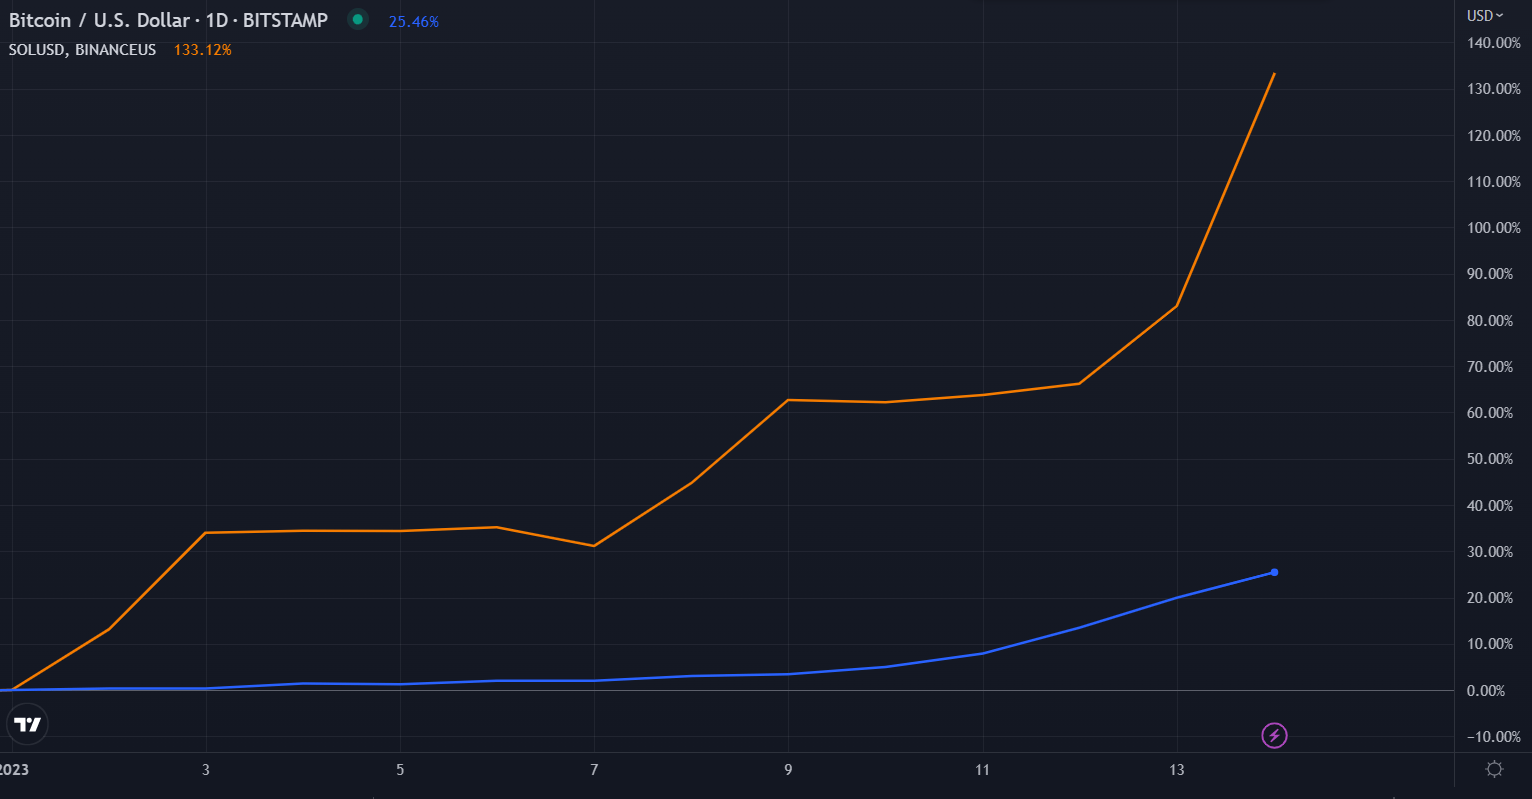
($SOL vs $BTC in 2023)
Bottom fishing is the absolute hardest way for market participants to make money. In the world of technical analysis that I subscribe to, I look to buy assets that are trending higher and displaying relative strength compared to the market. The assets leading 2023 are the polar opposite of what my screening for. The assets leading in 2023 have been in brutal downtrends for over a year and out of nowhere they start ripping higher. I’ll be the first to admit I missed these explosive moves. They didn’t meet the criteria for my buying process and that’s ok. To be successful in the markets you don’t need to be a part of every move higher. You just need to participate when your edge applies and your risk is defined.
If bottom fishing continues to be the theme of 2023, the year is going to be very difficult for breakout buyers like myself. This means the leaders are going to continue to rotate and the new leaders will be last month’s laggers. But, if the leaders can hold their ground and keep their upward trajectories, then breakout buyers have a chance to make huge gains.
CONCLUSION:
Two weeks into 2023 and most participants have been caught off guard to the current market leaders. Last year’s worst performing assets are taking charge and leading 2023. Will bottom fishing continue or will these early leaders continue their moves higher throughout the year? Only time will tell…

Leave a comment