Navigating the Crypto Market: From Breakout Trades to Long-Term Accumulation
Introduction
The crypto market is a constant cycle of euphoria and fear, rewarding those who can adapt to shifting conditions. My approach has always been rooted in technical signals, focusing on trend strength, volume, and momentum indicators to guide both trading and investment decisions. This post breaks down my journey from high-momentum breakout trades in late 2024 to a more patient accumulation strategy in early 2025. By analyzing key market shifts, trade executions, and current positioning, I’ll outline how I navigated the past several months—and how I’m preparing for what’s next.
Where We Came From
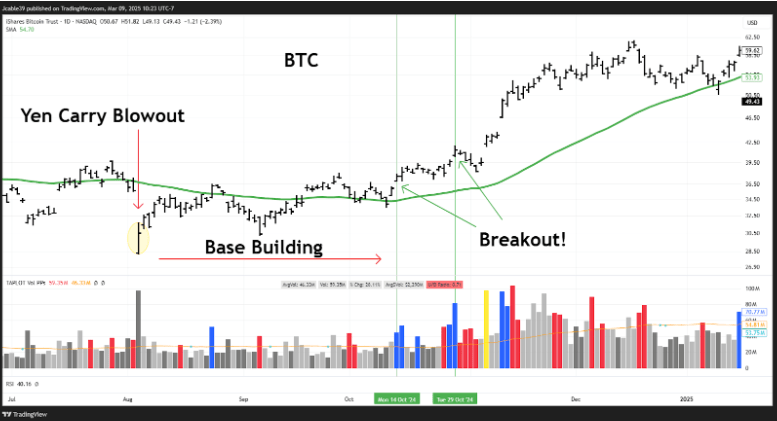
If I’m going to paint a complete picture of where the crypto trade started, then we need to go back to August 5th, 2024. This was the infamous “Yen Carry Trade” blowup that saw the VIX spike as high as 65 intraday. The Nasdaq 100 (QQQ) and Bitcoin (BTC) were down intraday 6.5% and 15.5%, respectively. This was a time of absolute panic. CNBC ran their “Markets in Turmoil” special, bears were pounding their chests and the average Twitter account was completely blown away with the downside thrust taking place. It really did feel like the bull market was ending.
But as you know, the bulls stepped in right where they needed to. For the next two months, BTC traded sideways, building a base, giving the 50-day SMA time to flatten out. If you’ve read my previous posts, you know the 50-day SMA is an uber important trend indicator for me. It’s how I determine uptrends, downtrends and sideways action. In the simplest terms, price above 50-day SMA = bullish, price below = bearish, price chopping above and below = sideways.
In the middle of October, BTC started trading above the 50-day SMA and there was a change in character. Look at Chart 1.1. On October 14th, huge buying volume came into BTC and the breakout was on. Then, on October 29th, an additional buy point registered, again, on huge volume.

Chart 1.1: BTC breaking out of the Yen Carry Blowout base
But the bullishness wasn’t signatory to BTC. I bought large positions in DOGE and SUI, two altcoins I felt were relative strength leaders in the market. Charts 1.2 and 1.3 show how I bought DOGE and SUI, respectively. Just like BTC, DOGE and SUI were bought with price above the 50-day SMA, on days with a huge buying volume pressure.

Chart 1.2: DOGE Breakout in October. Buys are noted with green vertical lines.

Chart 1.3: SUI Breakout in October. Buys are noted with green vertical lines.
When I Sold
DOGE and SUI were my best trades of 2024, netting over 100% profits in less than two months. Things were looking great until mid-December. DOGE stopped me out on December 19th, with price closing below the 50-day SMA. Cracks in the meme sector were forming. Pepe the Frog (PEPE) and Dog wif Hat (WIF) both experienced huge declines in December. After closing below their 50-day SMA, they never looked back, with PEPE down 65% and WIF down 84%.
I held onto SUI the longest, finally selling on January 25th, 2025. The upside momentum just wasn’t there anymore. Chart 1.4 shows this. The daily RSI peaked in late November 2024, and made a series of lower highs, never confirming the new ATHs in price SUI was making. SUI closing below the 50-day SMA was the final nail in the coffin and price is down 45% since I sold.

Chart 1.4: SUI losing momentum. RSI making lower highs as price made higher highs.
The entire crypto market was experiencing this loss of momentum. Bearish RSI Divergence was rampant, and looking at an index level, you can see this momentum loss via TOTAL.

Chart 1.5: TOTAL with Bearish RSI Divergence. TOTAL = Total crypto market capitalization
What I’m Doing now
So how am I playing the new market regime? Trading has absolutely dried up. I am not a short term trader. I trade using daily bars and I only trade cryptos that are above their 50-day SMA. And guess how many of those setups are available? Yes, great guess, pretty much ZERO. That’s why I’ve shifted into investor mode. While the trading momentum is gone, the accumulation era has reemerged.
I only invest in crypto when there are serious problems. Unlike 99% of retail investors, I never purchase an investment when there is positive sentiment around a crypto. “Be fearful when others are greedy and be greedy only when others are fearful.” Shoutout to the OG Warren Buffet.

There are five coins I buy and hold. BTC, Ethereum (ETH), Solana (SOL), AAVE and Ondo Finance (ONDO). They are weighted in my portfolio in the same order. There are two ways I accumulate them:
- When the daily RSI goes oversold (under 30), buy when the daily RSI is no longer oversold (above 30) AND price closes above the 10-day SMA.
- When the weekly RSI goes oversold (under 30), buy when the weekly RSI is no longer oversold (above 30) AND price closes above the 10-week SMA.
That’s it. That’s my accumulation strategy. It’s that simple. Wait for crypto sentiment to be low, evident by the RSI being oversold and buy when price signals there’s been a potential change in the downtrend, evident by price closing above a short term moving average.
So that’s what I did. I bought all the coins mentioned above last Sunday, March 2nd. So far, I haven’t bought the bottom. All coins are trading lower than my purchase price and I am totally ok with that. This is a long term accumulation strategy and I have deployed very little capital. My buys last week were less than 4% of my overall net worth. There’s still plenty of powder in the keg, and if I’m being honest, I hope we go lower, way lower. Looking at Chart 1.6, BTC could drop to $70,000 and I would still feel confident the bull market is intact.

Chart 1.6: BTC Weekly Chart with Fibonacci Retracements
Holding $70,000 as support would provide a November breakout retest and is a logical area for bulls to stepin, given $70,000 is also roughly the 2021 cycle peak. BUT, if we start trading below $70,000, look out below. Things could get very ugly.
Final Thoughts
This strategy is designed to remove emotion from the equation. The market will always fluctuate, but by sticking to objective signals—like RSI levels and moving averages—I can execute disciplined trades. Whether BTC bounces off $70,000 or drops further, I have a plan in place. The key is patience and strategic capital deployment in times of fear.

Leave a comment