Quick Bitcoin Update
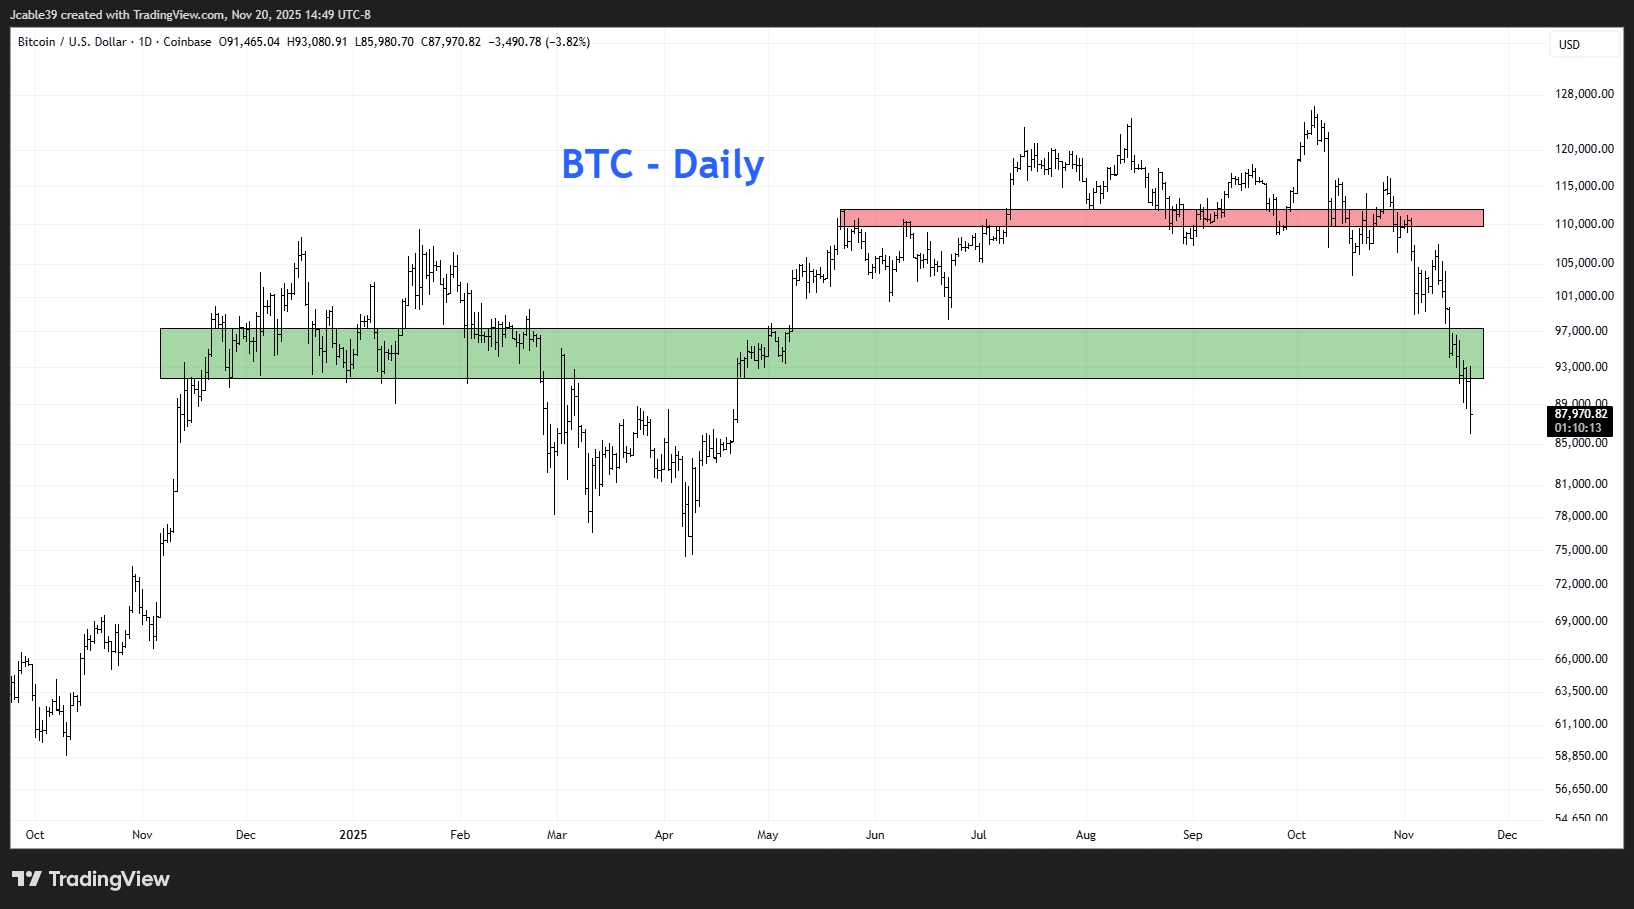
Since peaking at $126,000 in early October, Bitcoin (and the entire cryptocurrency market for that matter) has been in a free fall. After failing to hold the $110,000 support level, Bitcoin is now trading at $88,000. This represents a 30% peak price to current value drawdown. Given the current market structure, it’s difficult to maintain a bullish thesis even over a quarter to six-month timeframe. Here’s a chart of Bitcoin blowing through the $110,000 support and pushing below the $90,000 support level.
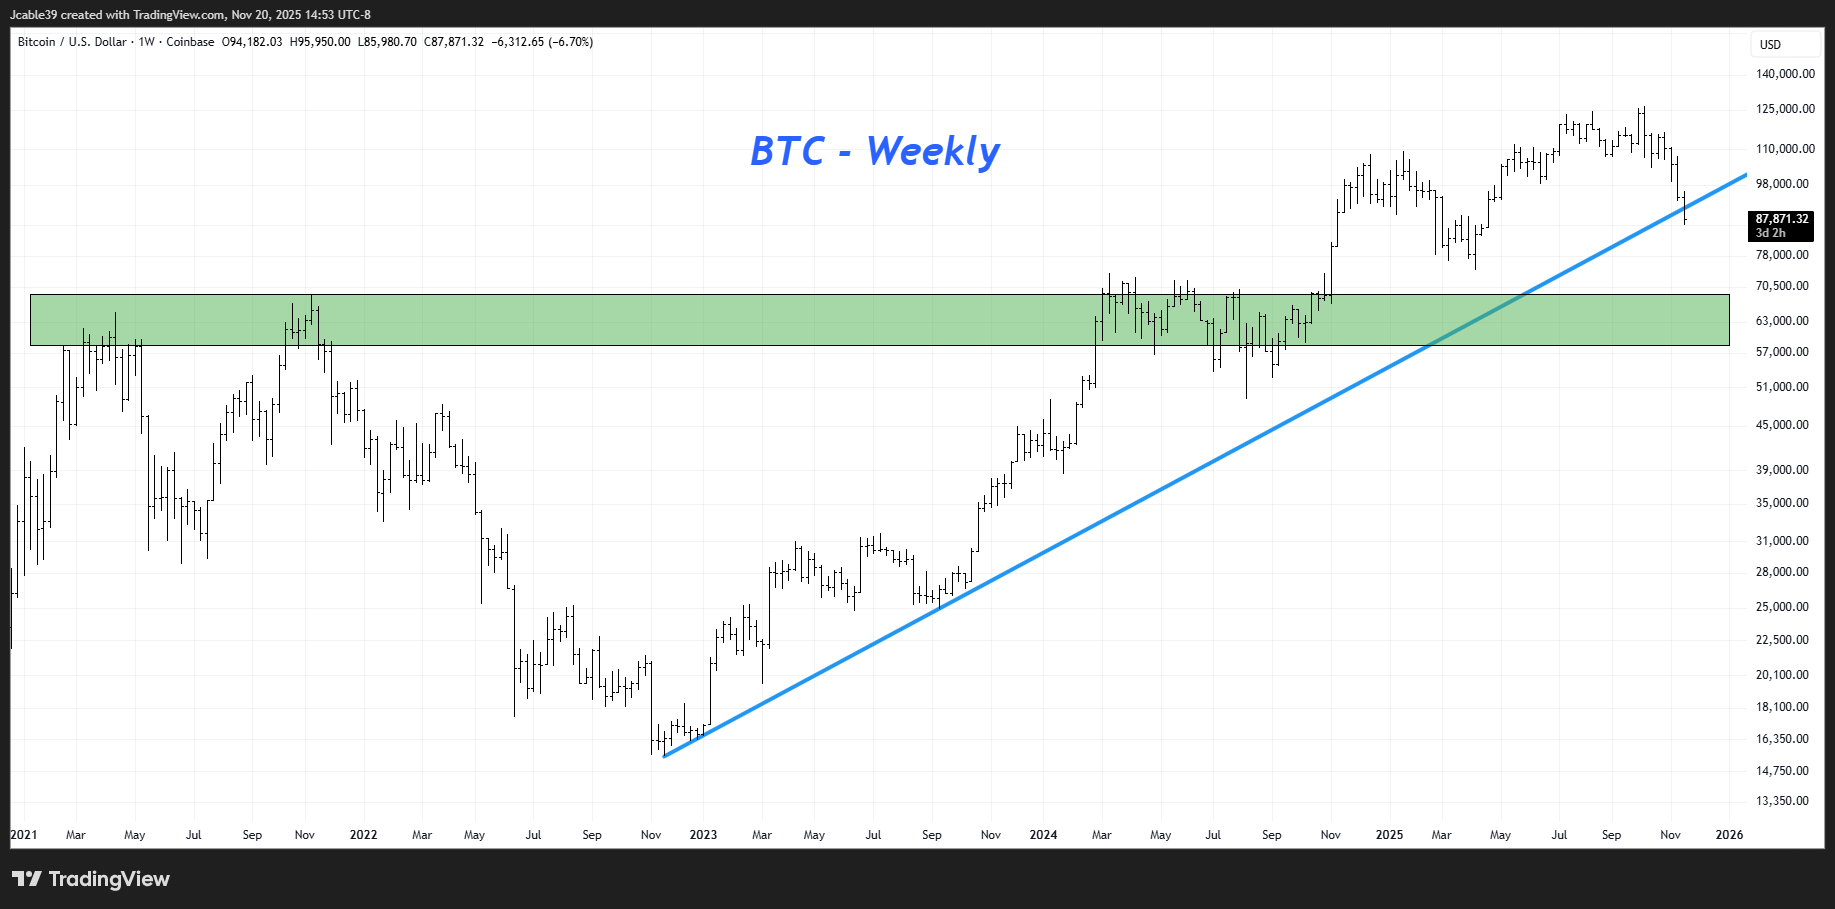
When things start to get messy my first thought is, Zoom Out. So, let’s do that. Weekly charts are my preferred way to look at the market, they provide a clear picture on the current price trend and give clarity on where bigtime buyers and sellers are going to show up. So what is the weekly chart of Bitcoin telling us? Bitcoin bulls need to make a stand. If prices this week close at the current level, it would represent an invalidation of the almost three year long uptrend line. Weekly trendlines are important because they filter out day-to-day noise and reveal the true, dominant trend that you want your trades and investments to follow. If that line breaks and holds, it’s not just a bad week—it’s a potential regime change you can’t afford to ignore.
So there’s your quick update. Bearish, Bearish, Bearish. As any good analyst would say, you need to have your counterargument in mind. So what would make me start to lean bullish? Good question, and it’s a simple answer. Bitcoin needs to stop going down. And this isn’t just a couple day bounce. What I really need to see is Bitcoin reclaiming the $90,000 support level and trading in the $94,000 to $98,000 trade. If price can trade there, then it’s possible a short-term bottom is in.

Leave a comment