-
Quick Bitcoin Update
Quick Bitcoin Update Since peaking at $126,000 in early October, Bitcoin (and the entire cryptocurrency market for that matter) has been in a free fall. After failing to hold the $110,000 support level, Bitcoin is now trading at $88,000. This represents a 30% peak price to current value drawdown. Given the current market structure, it’s…
-
The Commodity Renaissance: How to Navigate the Next Market Supercycle

Commodities have been a forgotten asset class for 99% of investors. Doing a quick search, the average investor dedicates 3-5% of their total portfolio value to commodities. Digging deeper, of that 3-5%, 50-70% of that allocation is represented by gold. But there is a much larger world of commodities available for investment. ETFs have given…
-
Navigating the Crypto Market: From Breakout Trades to Long-Term Accumulation
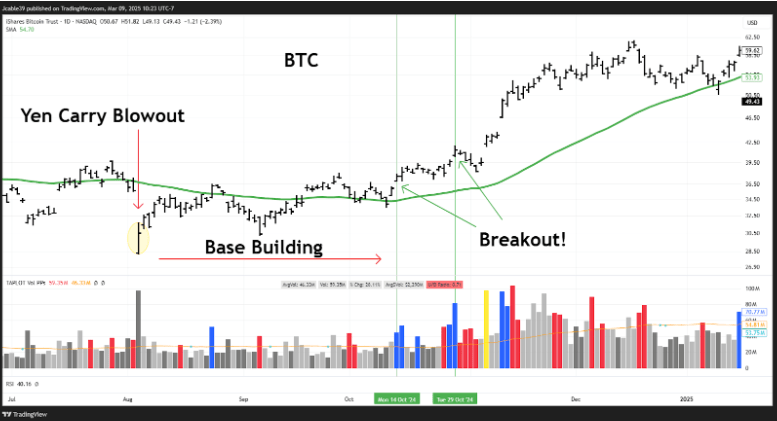
Navigating the Crypto Market: From Breakout Trades to Long-Term Accumulation Introduction The crypto market is a constant cycle of euphoria and fear, rewarding those who can adapt to shifting conditions. My approach has always been rooted in technical signals, focusing on trend strength, volume, and momentum indicators to guide both trading and investment decisions. This…
-
Intermarket Analysis: Assessing Economic Growth Expectations through the SPY/TLT Ratio and Key Equities
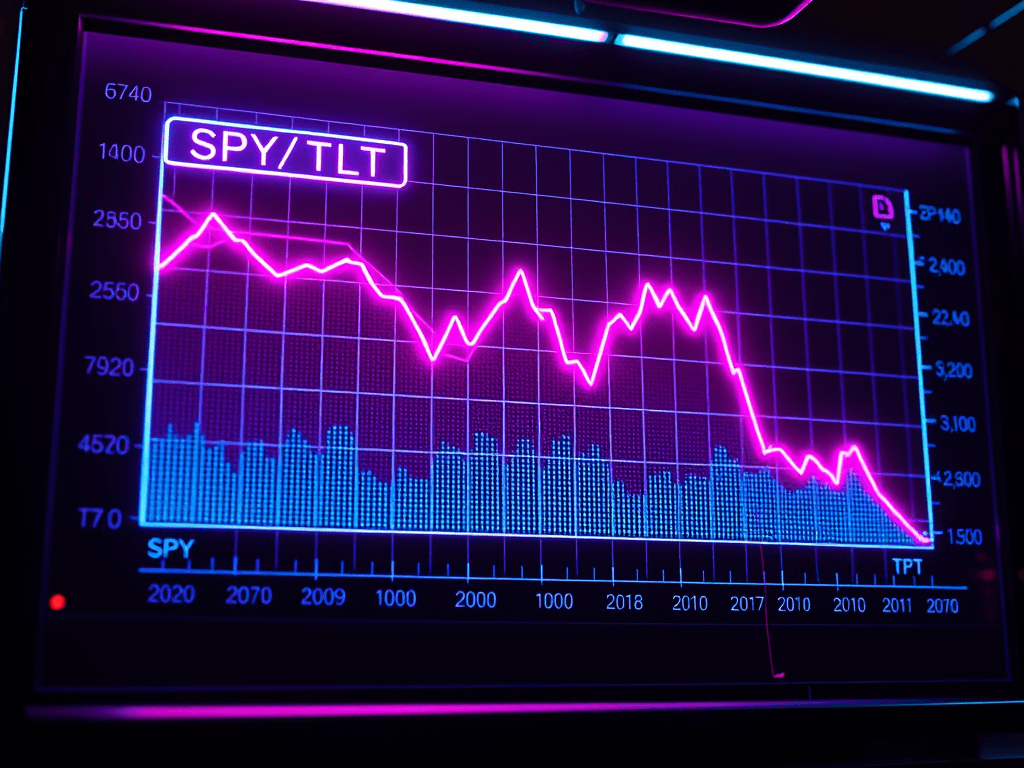
Intermarket analysis has been a cornerstone of technical analysis since John J. Murphy published Intermarket Analysis: Profiting from Global Market Relationships in 1991. While technicians have long studied relationships between asset classes, Murphy was the first to formalize a framework for using these relationships to improve portfolio performance. One of the most effective ways to…
-
Post-Election Crypto Surge Fizzles: Is the Bull Run Over or Just Taking a Breather?

With President Trump winning the 2024 election, the buzz around crypto was high, and expectations for price increases were even higher. The spike in crypto prices following the November 6th election looked like the breadth thrust that was going to propel the entire market to new all-time highs. And from November 6th to mid-December, that’s…
-
Strong Dividend Growth Stocks on Sale: MUSA, BX, and UNH Offer Unique Investment Opportunities Amid Market Weakness
A dividend growth stock is a type of equity investment that consistently increases its dividend payments over time, offering investors a growing stream of passive income. The key characteristic of such a stock is its dividend growth percentage, which reflects how much the dividend has increased year-over-year. Ideally, a dividend growth stock will show a…
-
Macroeconomic Analysis- The Current Inverse Relationship Between the US Dollar and the S&P 500

Macroeconomic Analysis – The Current Inverse Relationship Between the US Dollar and the S&P 500 Introduction As a follower of technical analysis, you must pay attention to the macroeconomic trends that are playing out in our world. For the world economy, there is no more powerful macroeconomic relation than the current inverse correlation between the…
-
Potential Stage Two Breakouts (Stan Weinstein)
Potential Stage Two Breakouts (Stan Weinstein) INTRODUCTION: The stock market is the picture of chaos. Everyday, trillions of dollars are exchanged and millions of market participants fight to acquire the most money. How can you possibly determine what is going on? Which stocks are leading the pact? Which stocks are on the verge of a…
-
Is the Technology Bear Market Over?
Link to YouTube video: https://www.youtube.com/watch?v=7VJqcJJIvyc Trend following is nothing more than interrupting what is. There is no guessing or predicting involved, you simply look at the market structure to determine if the asset is in an uptrend or a downtrend. Trend trading is an essential component of the technical analysis approach. Investopedia defines trend trading…
-
Laggers are Leading in 2023
2022: THE YEAR OF PAIN 2022 was a tough year for many market participants. The benchmarks for the United States economy, S&P 500 ($SPY), NASDAQ 100 ($QQQ) and the Dow Jones Industrial Average ($DIA) all had losing years. These indices were down 16.58%, 30.05% and 6.19%, respectively. (2022 performance of $SPY, $QQQ and $DIA) This…
Follow the Money, Trade the Trend
Trade like today's market experts.
